

Social media metrics worth tracking
The social media metrics worth tracking, what each one tells you and how to report them.
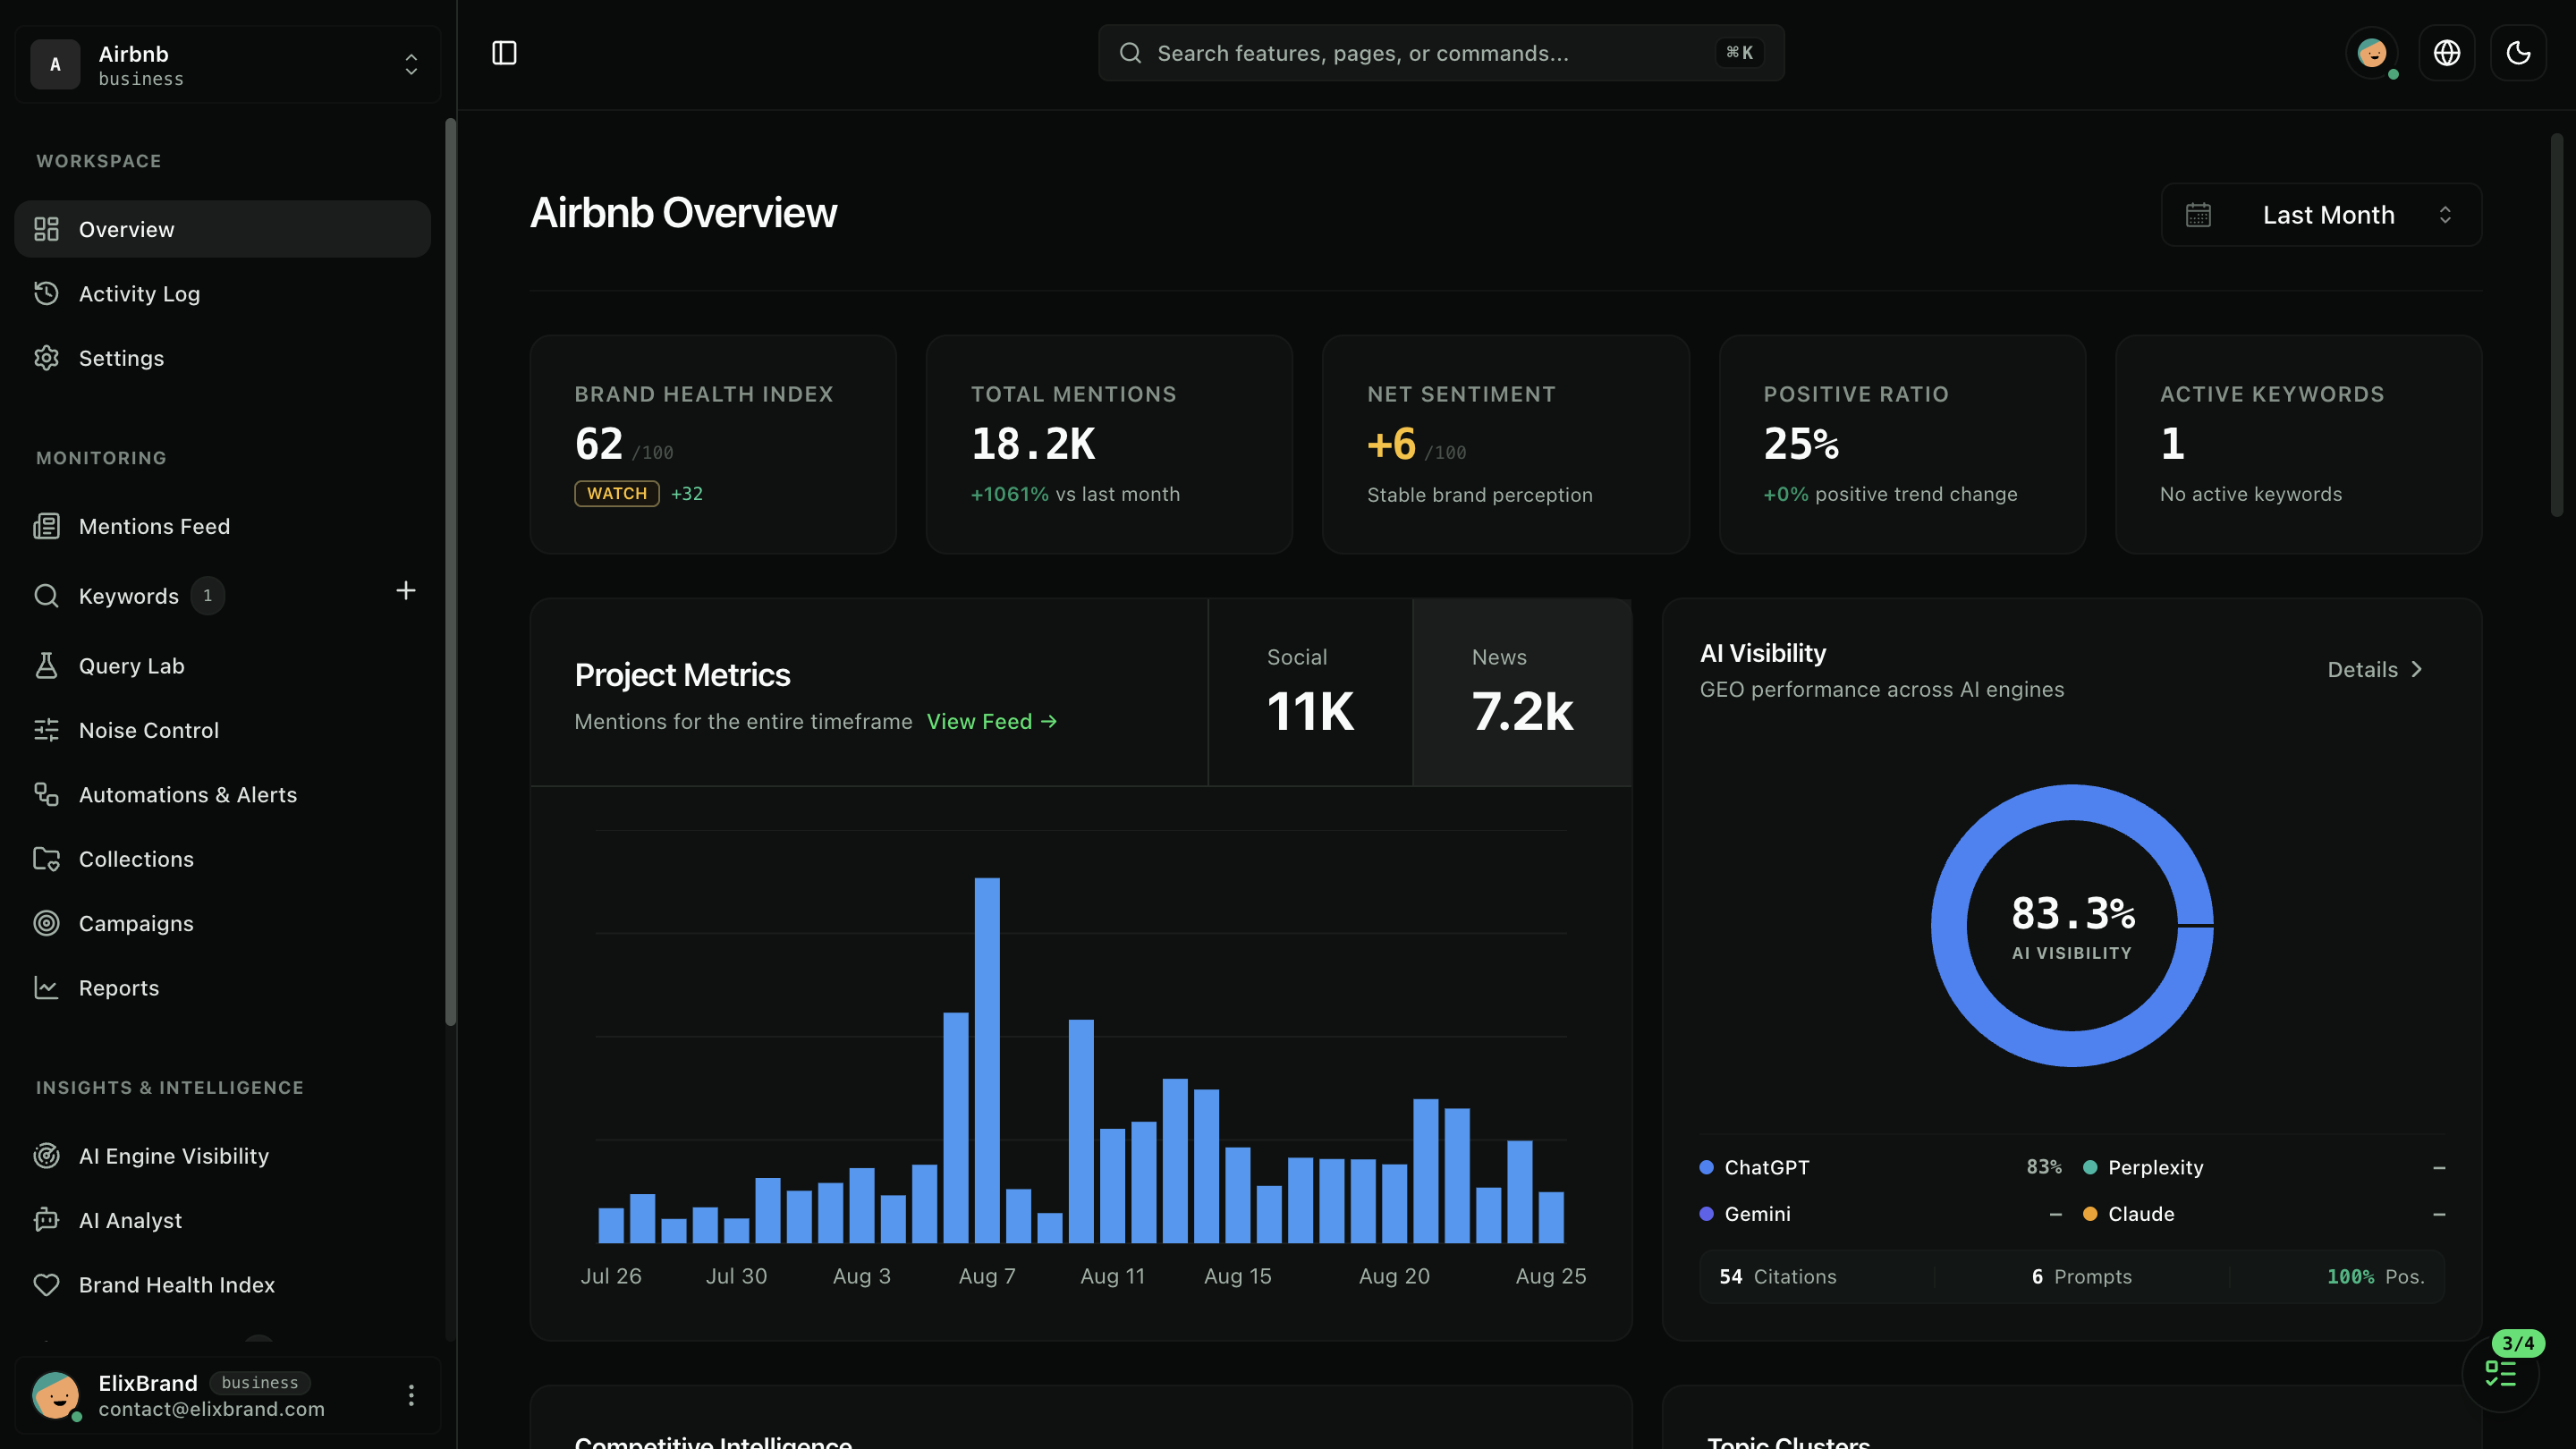
Most monthly social media reports suffer from the same problem: they are packed with numbers—follower counts, raw likes, potential impressions—that look busy on a slide deck but tell leadership almost nothing about whether brand reputation, customer trust, or market share actually improved.
When you combine social listening, media monitoring, and AI Search Visibility, you can replace vanity counters with metrics that explain what the market thinks of your brand, how you stack up against competitors, and where your team needs to act next.
Here are the 12 social media and brand intelligence metrics worth tracking in 2026, grouped by what they measure, complete with formulas, interpretation rules, and how to report them in Report Studio.
Summary Table: The 12 Social Media Metrics That Actually Matter
| # | Metric | Category | Formula / Definition | Who Cares Most |
|---|---|---|---|---|
| 1 | Total Mention Volume (Tagged + Untagged) | Visibility | Count of all public posts, articles, threads & comments mentioning your brand | Marketing, PR & Comms |
| 2 | Mention Velocity (Spike Rate) | Crisis & Momentum | % change in hourly or daily mentions vs. 7-day rolling baseline | PR, Crisis & Support |
| 3 | Net Sentiment Score (NSS) | Brand Perception | ((Positive - Negative) / Total Mentions) × 100 (-100 to +100 scale) | CMO, PR & Product |
| 4 | Emotion Distribution | Customer Insight | % breakdown across Joy, Anger, Fear, Sadness & Surprise | Product, Support & PR |
| 5 | Competitive Share of Voice (Volume SOV) | Market Share | (Your Mentions / Total Mentions of You + Competitors) × 100 | CMO, Leadership & Sales |
| 6 | Reach-Weighted Share of Voice | Earned Media Impact | (Your Estimated Reach / Total Category Estimated Reach) × 100 | PR Teams & Agencies |
| 7 | Positive Sentiment Share of Voice | Quality of Visibility | (Your Positive Mentions / Total Category Positive Mentions) × 100 | Executive Leadership |
| 8 | Estimated Audience Reach | Exposure | Sum of audience reach across publications, channels & authors mentioning you | PR & Campaign Leads |
| 9 | AI Share of Model (GEO Visibility) | AI Search Discovery | % of buyer-intent prompts on ChatGPT, Gemini & Claude recommending your brand | Growth, SEO & CMO |
| 10 | Topic & Theme Sentiment Balance | Product & Positioning | Net Sentiment segmented by specific topic cluster (e.g., Pricing, Support, UX) | Product & Positioning |
| 11 | Creator & Journalist Advocacy Ratio | Media Relations | Ratio of repeat positive creators/outlets vs. critical voices over 90 days | PR & Influencer Leads |
| 12 | Time-to-First-Response on Negative Mentions | Reputation Defense | Median minutes from a high-priority negative mention to public or direct resolution | Customer Care & Comms |
Part 1: Brand Visibility & Momentum Metrics
1. Total Mention Volume (Tagged + Untagged)
What it is: The total number of times your brand, products, or executives were mentioned across social media, Reddit, YouTube, forums, blogs, review sites, podcasts, newsletters, and news outlets—whether or not the author used your @handle.
Why it matters: Native social analytics only count posts that tag your official handle. Tracking untagged plain-text mentions via brand mention monitoring typically uncovers 3x to 5x more organic buyer conversations.
How to report it: Always report total mentions alongside a source breakdown (e.g., 40% Social, 25% Forums/Reddit, 20% News/Blogs, 15% Video/Podcasts) so stakeholders see where conversations are actually happening.
2. Mention Velocity (Anomaly & Spike Rate)
What it is: How fast your mention volume is accelerating compared to your normal 7-day or 30-day rolling average.
Why it matters: A raw count of 500 mentions in a month is normal; 350 mentions inside a 2-hour Tuesday morning window is either a viral win or a breaking PR crisis. Tracking velocity powers automated crisis alerts so your team gets notified in Slack or Telegram at the beginning of a curve, not the end.
Part 2: Brand Perception & Customer Emotion Metrics
3. Net Sentiment Score (NSS)
What it is: A single composite score from -100 to +100 measuring the balance between positive and negative conversation:
Net Sentiment Score = ((Positive Mentions - Negative Mentions) / Total Mentions) × 100
(In ElixBrand's sentiment analysis taxonomy, Positive includes both positive and strongly positive, Negative includes both negative and strongly negative, and uncategorized factual mentions default to neutral.)
Why it matters: Net Sentiment instantly distinguishes between a celebratory volume spike and a reputation backlash.
How to report it: Segment Net Sentiment by platform. Because news articles are naturally 65%+ neutral and Reddit is naturally more critical than LinkedIn, tracking platform-specific Net Sentiment trends prevents channel mix changes from distorting your numbers.
4. Five-Emotion Distribution (Joy, Anger, Fear, Sadness, Surprise)
What it is: The percentage breakdown of the specific human emotions driving your mentions.
Why it matters: Two negative spikes can require opposite responses:
- High Anger (e.g., billing errors or service downtime) demands immediate support escalation and public acknowledgment.
- High Fear (e.g., security rumors or regulatory changes) demands an authoritative, factual statement from leadership.
- High Sadness (e.g., deprecation of a favorite feature) is a signal for product management.
Part 3: Competitive Benchmarking Metrics
5. Competitive Share of Voice (Volume SOV)
What it is: Your brand's percentage of total market conversation compared to your tracked competitors:
Volume SOV (%) = (Your Brand Mentions / Total Mentions of Your Brand + All Competitors) × 100
Why it matters: Mention volume in isolation can be misleading during a slow seasonal month. If your mentions dropped 10% in August, but your Share of Voice rose from 28% to 35%, you actually gained ground on your competitors during a quiet market period.
6. Reach-Weighted Share of Voice
What it is: Your share of total estimated audience reach (metrics.reach) compared to your competitors across news, blogs, video, and social channels.
Why it matters: If a competitor gets 200 mentions from tiny bot accounts while your brand lands 15 feature stories in major trade publications and large YouTube channels, your Volume SOV might look lower while your Reach-Weighted SOV dominates the market.
7. Positive Sentiment Share of Voice
What it is: Your brand's share of all positive mentions across your competitive set:
Positive SOV (%) = (Your Positive Mentions / Total Positive Mentions Across You + Competitors) × 100
Why it matters: When a competitor suffers a massive PR scandal, their raw mention volume explodes. Positive Sentiment SOV ensures a rival's crisis never looks like a competitive win in your board report.
8. Estimated Audience Reach & Exposure
What it is: The cumulative estimated audience size (metrics.reach) of the publications, channels, and authors mentioning your brand.
Why it matters: Helps PR teams prioritize which earned media placements and creator mentions delivered the greatest visibility.
Part 4: AI Search, Topic & Operational Metrics
9. AI Share of Model (AI Search Visibility)
What it is: The percentage of buyer-intent prompts on ChatGPT, Google Gemini, Perplexity, and Claude in which the AI assistant recommends or cites your brand compared to competitors.
Why it matters: In 2026, buyers increasingly ask AI assistants "What is the best [category] tool for [use case]?" instead of clicking ten search links. Auditing your AI Search Visibility alongside social metrics shows whether your earned media and social proof are successfully translating into AI recommendations.
10. Topic & Theme Sentiment Balance
What it is: Grouping mentions into recurring themes (such as Customer Support, Pricing, Onboarding, Reporting, Reliability) and calculating Net Sentiment for each topic individually.
Why it matters: A blended Net Sentiment of +35 might hide the fact that Product Reliability is at +72 while Pricing & Billing is at -40. Topic sentiment tells executives exactly which lever to pull.
11. Creator & Journalist Advocacy Ratio
What it is: The number of active journalists, newsletter authors, and creators who consistently cover your brand positively versus critically over a rolling 90-day window.
Why it matters: Tracks the health of your media relationships and alerts your PR team immediately if a formerly supportive industry voice turns critical.
12. Time-to-First-Response on Priority Negative Mentions
What it is: The median time elapsed between a high-reach or high-anger negative mention appearing online and your team acknowledging or resolving it.
Why it matters: Keeping response time under 60 minutes (the "Golden Hour" of crisis management) prevents Stage 1 complaints from escalating into Stage 3 press stories—and directly drives customer churn reduction.
How to Report These 12 Metrics Without Building Slide Decks by Hand
Tracking twelve metrics across multiple channels sounds exhausting if you are still copying numbers into spreadsheets. In ElixBrand Report Studio, every metric in this guide is available as a live drag-and-drop block:
- Pick a Template: Start with the Executive Summary, PR Coverage Book, Competitive Benchmark, or Brand Health Index template.
- Add Live Data & Editable AI Commentary: Drop in Share of Voice charts, Net Sentiment timelines, Emotion breakdowns, Top Mentions tables, and AI Search Visibility scorecards—each paired with an AI-written narrative summary you can edit.
- Export or Schedule in 18 Languages: Apply your logo and brand colors, export to PDF, CSV, or Excel, or schedule automatic weekly or monthly email delivery to your leadership team or agency clients.
Want to start tracking all 12 metrics today? Start your 7-day free trial of ElixBrand or test your current brand footprint right now with our Free Brand Mention Checker.
Monitor every news article, social mention, and AI citation in one place
Start tracking your brand across global press, Reddit, podcasts, newsletters, and ChatGPT/Gemini/Perplexity answers. Transparent monthly pricing from $29/mo.
Continue reading
All articlesSocial listening: the complete guide
What social listening is, how it differs from monitoring, which metrics to track and how to start. A practical guide with examples.
ElixBrand vs Brand24 (2026 Deep-Dive): Pricing, AI & Features
Comparing ElixBrand vs Brand24 in 2026. See how they stack up on pricing, mention limits, AI Search Visibility (GEO), crisis alerts, and sentiment accuracy.
The 10 best media monitoring tools in 2026
The best media monitoring tools and services in 2026, compared on coverage, reporting and price.